

Unlock Data Editing Magic: Translytical Task Flows in Power BI
Publish Date: February 18, 2026Imagine if your dashboards didn’t just inform decisions, they executed them!
For years, Power BI has been the go-to platform for transforming raw data into insights. But in most organizations, that’s where the story ends. Reports highlight issues, users identify gaps, and then the real work begins somewhere else, in emails, spreadsheets, ticketing systems, or transactional applications.
Now imagine a world where your Power BI reports aren’t static dashboards, but fully interactive data applications. A world where users can correct errors, add new records, and even delete outdated information, all without leaving Power BI.
That’s precisely what Translytical Task Flows in Power BI make possible. It’s a capability that doesn’t just enhance reporting; it shifts Power BI into a platform where insights turn into action instantly.
What Exactly Are Translytical Task Flows?
At their core, Translytical Task Flows enable write-back to Microsoft Fabric data sources directly from Power BI reports.
This means that changes made through a report are not temporary or local—they’re written back into a centralized, governed, and scalable Fabric data repository.
The term translytical is derived from blending transactional (OLTP) and analytical (OLAP) capabilities into a seamless experience. Instead of toggling between dashboards for insights and separate applications for actions, Power BI becomes a unified environment where users can analyze and act in the same flow.
How Translytical Task Flows Differ from Traditional Write-Back
Traditional write-back in BI tools has existed for some time, but it has often been limited, fragile, or difficult to scale.
Translytical Task Flows go far beyond simply updating a record. They enable Power BI to behave more like an operational system by allowing you to:
- Orchestrate business processes: CRUD operations can trigger workflows, approvals, or downstream processes.
- Integrate with external systems: APIs and apps can be invoked directly, extending Power BI beyond the dataset.
- Enable operational actions: Reports evolve from passive snapshots into decision hubs where action happens immediately.
The Magic Behind the Scenes: User Data Functions (UDFs)
Behind this capability is the concept of User Data Functions (UDFs) inside Microsoft Fabric.
UDFs provide the logic to manipulate data (create, read, update, delete), and can even call external APIs or automation scripts. In a sense, they act as the engine that makes Task Flows “translytical.”
Here’s how they work:
- Inputs: UDFs can take parameters directly from Power BI visuals such as buttons, text slicers, or list slicers. For example, a CustomerID can be passed via the SELECTEDVALUE DAX expression.
- Connections: Each UDF must connect to a Fabric data source (via an alias).
- Flexibility: UDFs support Python code (defaulting to pyodbc for SQL), enabling scenarios like writing back to Excel files in SharePoint or triggering semantic model refreshes.
- Outputs: To appear in Power BI’s dropdown menu, the UDF must return a string (such as a success or error message).
Practical Applications
The potential use cases are extensive — and this is where Translytical Task Flows become truly valuable. Instead of dashboards being the “end point,” they become the “launch point” for action.
Some practical examples include:
- Add comments or annotations to existing records.
- Insert workflow elements such as DAG nodes for orchestrating Fabric notebooks.
- Qualify leads by sending updates from Power BI to a CRM.
- Trigger budget approvals or send notifications via Teams.
- Invoke AI-powered recommendations using Azure OpenAI APIs.
- Manage Fabric pipelines and orchestrate engineering workflows via DAGs.
Getting Started: Building Your First Flow
The setup process typically follows three stages: storing data, developing data, and visualizing data.
Below is the flow
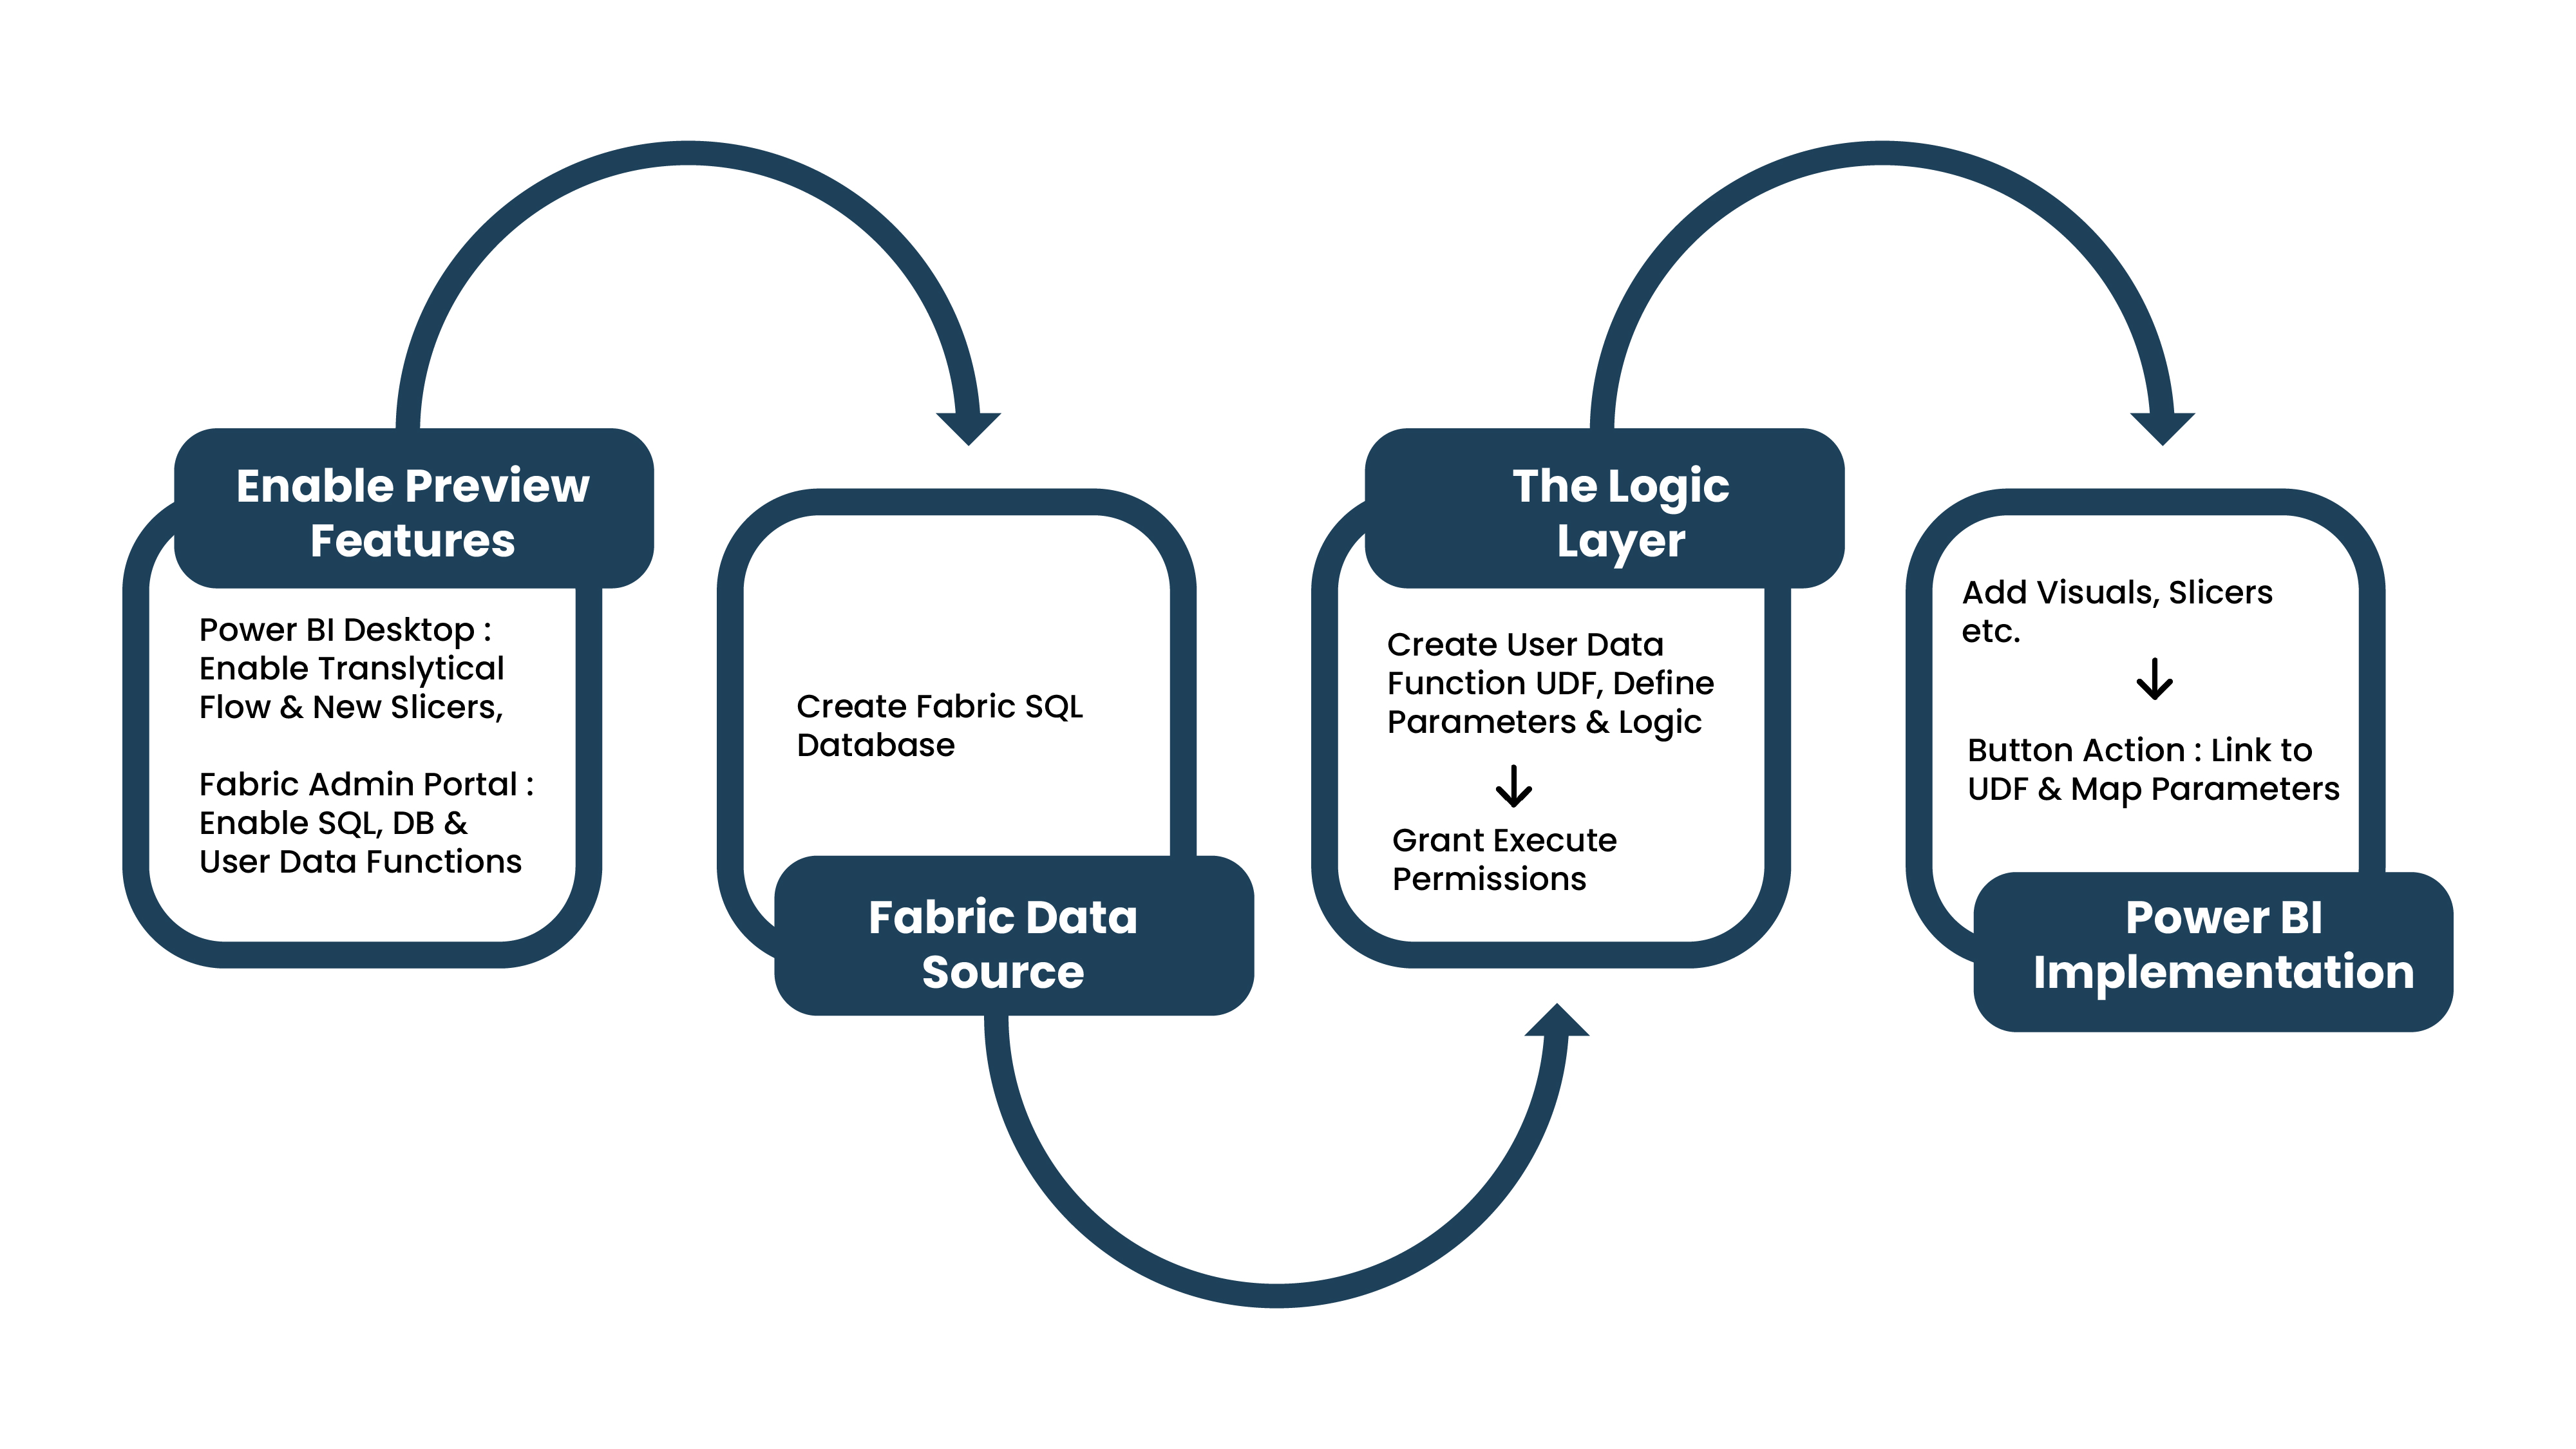
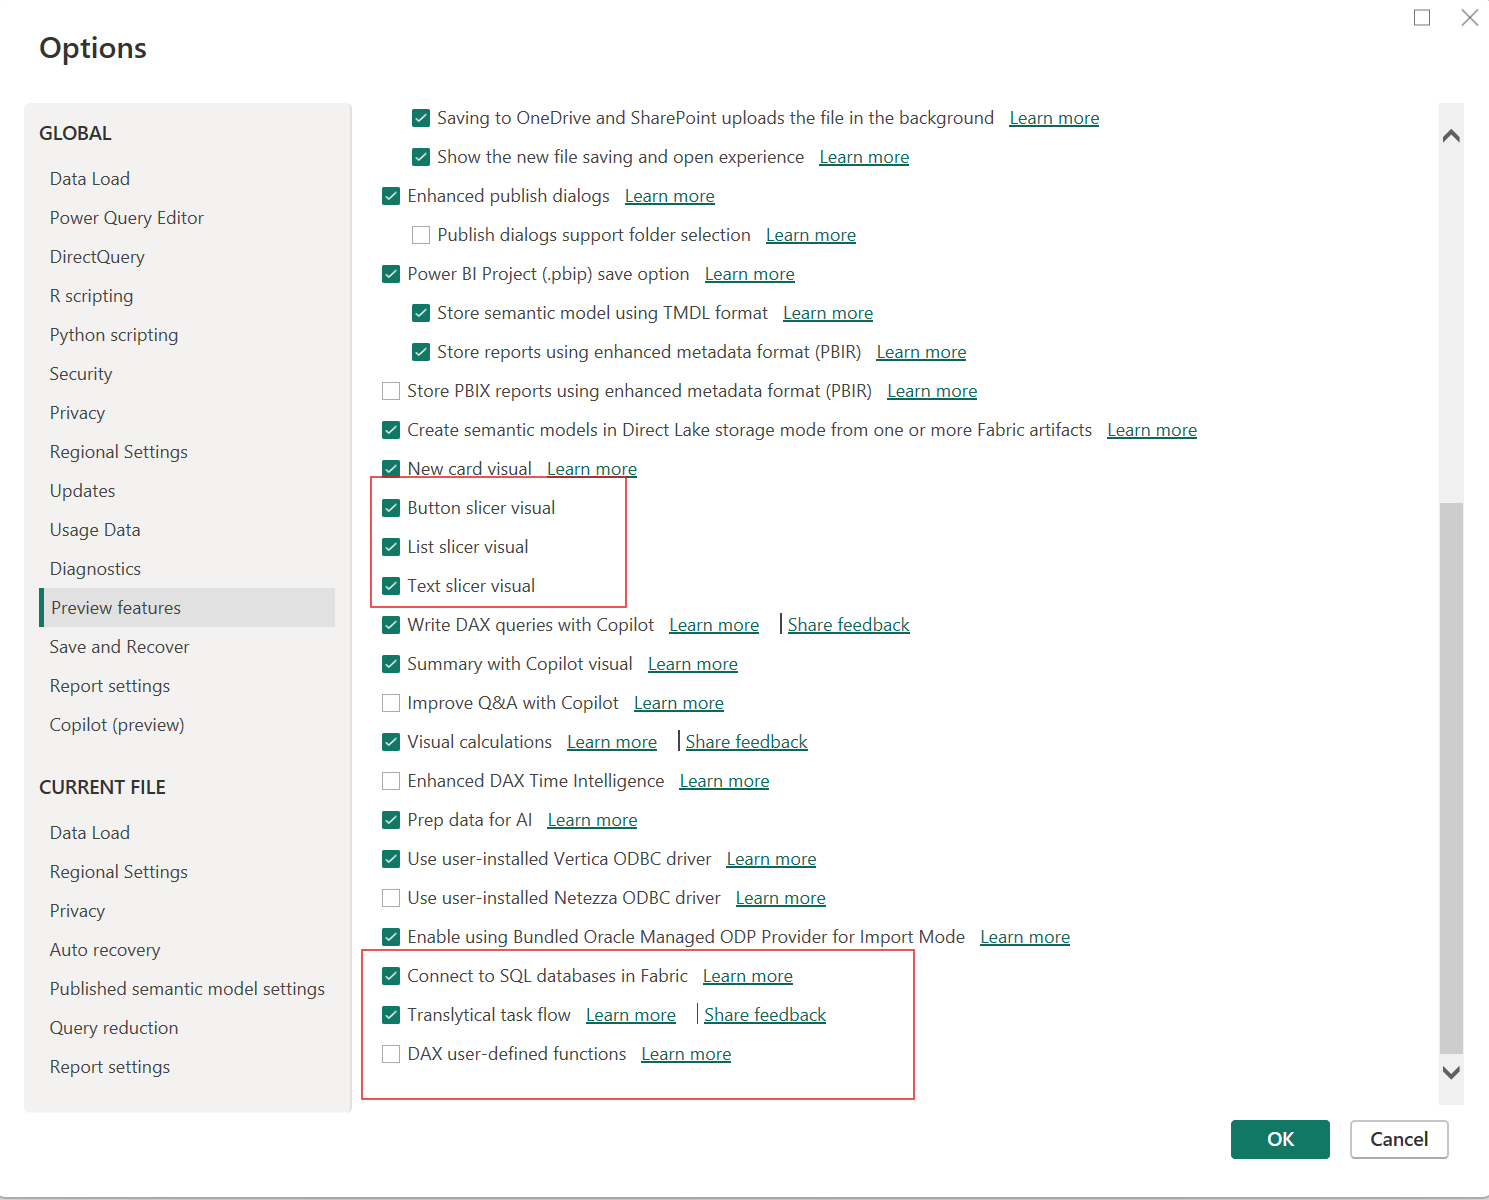
1. Enable Preview Features
- In Power BI Desktop (May 2025 or later), turn on Translytical task flows and new slicer visuals (text, button, list).
- Your workspace must be a Fabric workspace with access to Fabric user data functions, since these functions execute the actions behind the task flows.
- In the Fabric Admin Portal, enable SQL database and User Data Functions (preview).
2. Set Up a Fabric Data Source
- Create a Fabric SQL Database.
- Load sample data (e.g., AdventureWorksLT).
- Use DirectQuery mode for real-time updates.
3. Create a UDF in Fabric (Fabric User data functions)
- Connect to your UDF to Fabric SQL Database.
- Add and test your function code.
- Grant permissions for others to execute the function.
4. Build Your Power BI Report
- Connect to the Fabric SQL Database in DirectQuery mode.
- Add table visuals to display records.
- Insert slicers for user input.
- Create a button linked to your UDF, mapping slicer values as parameters.
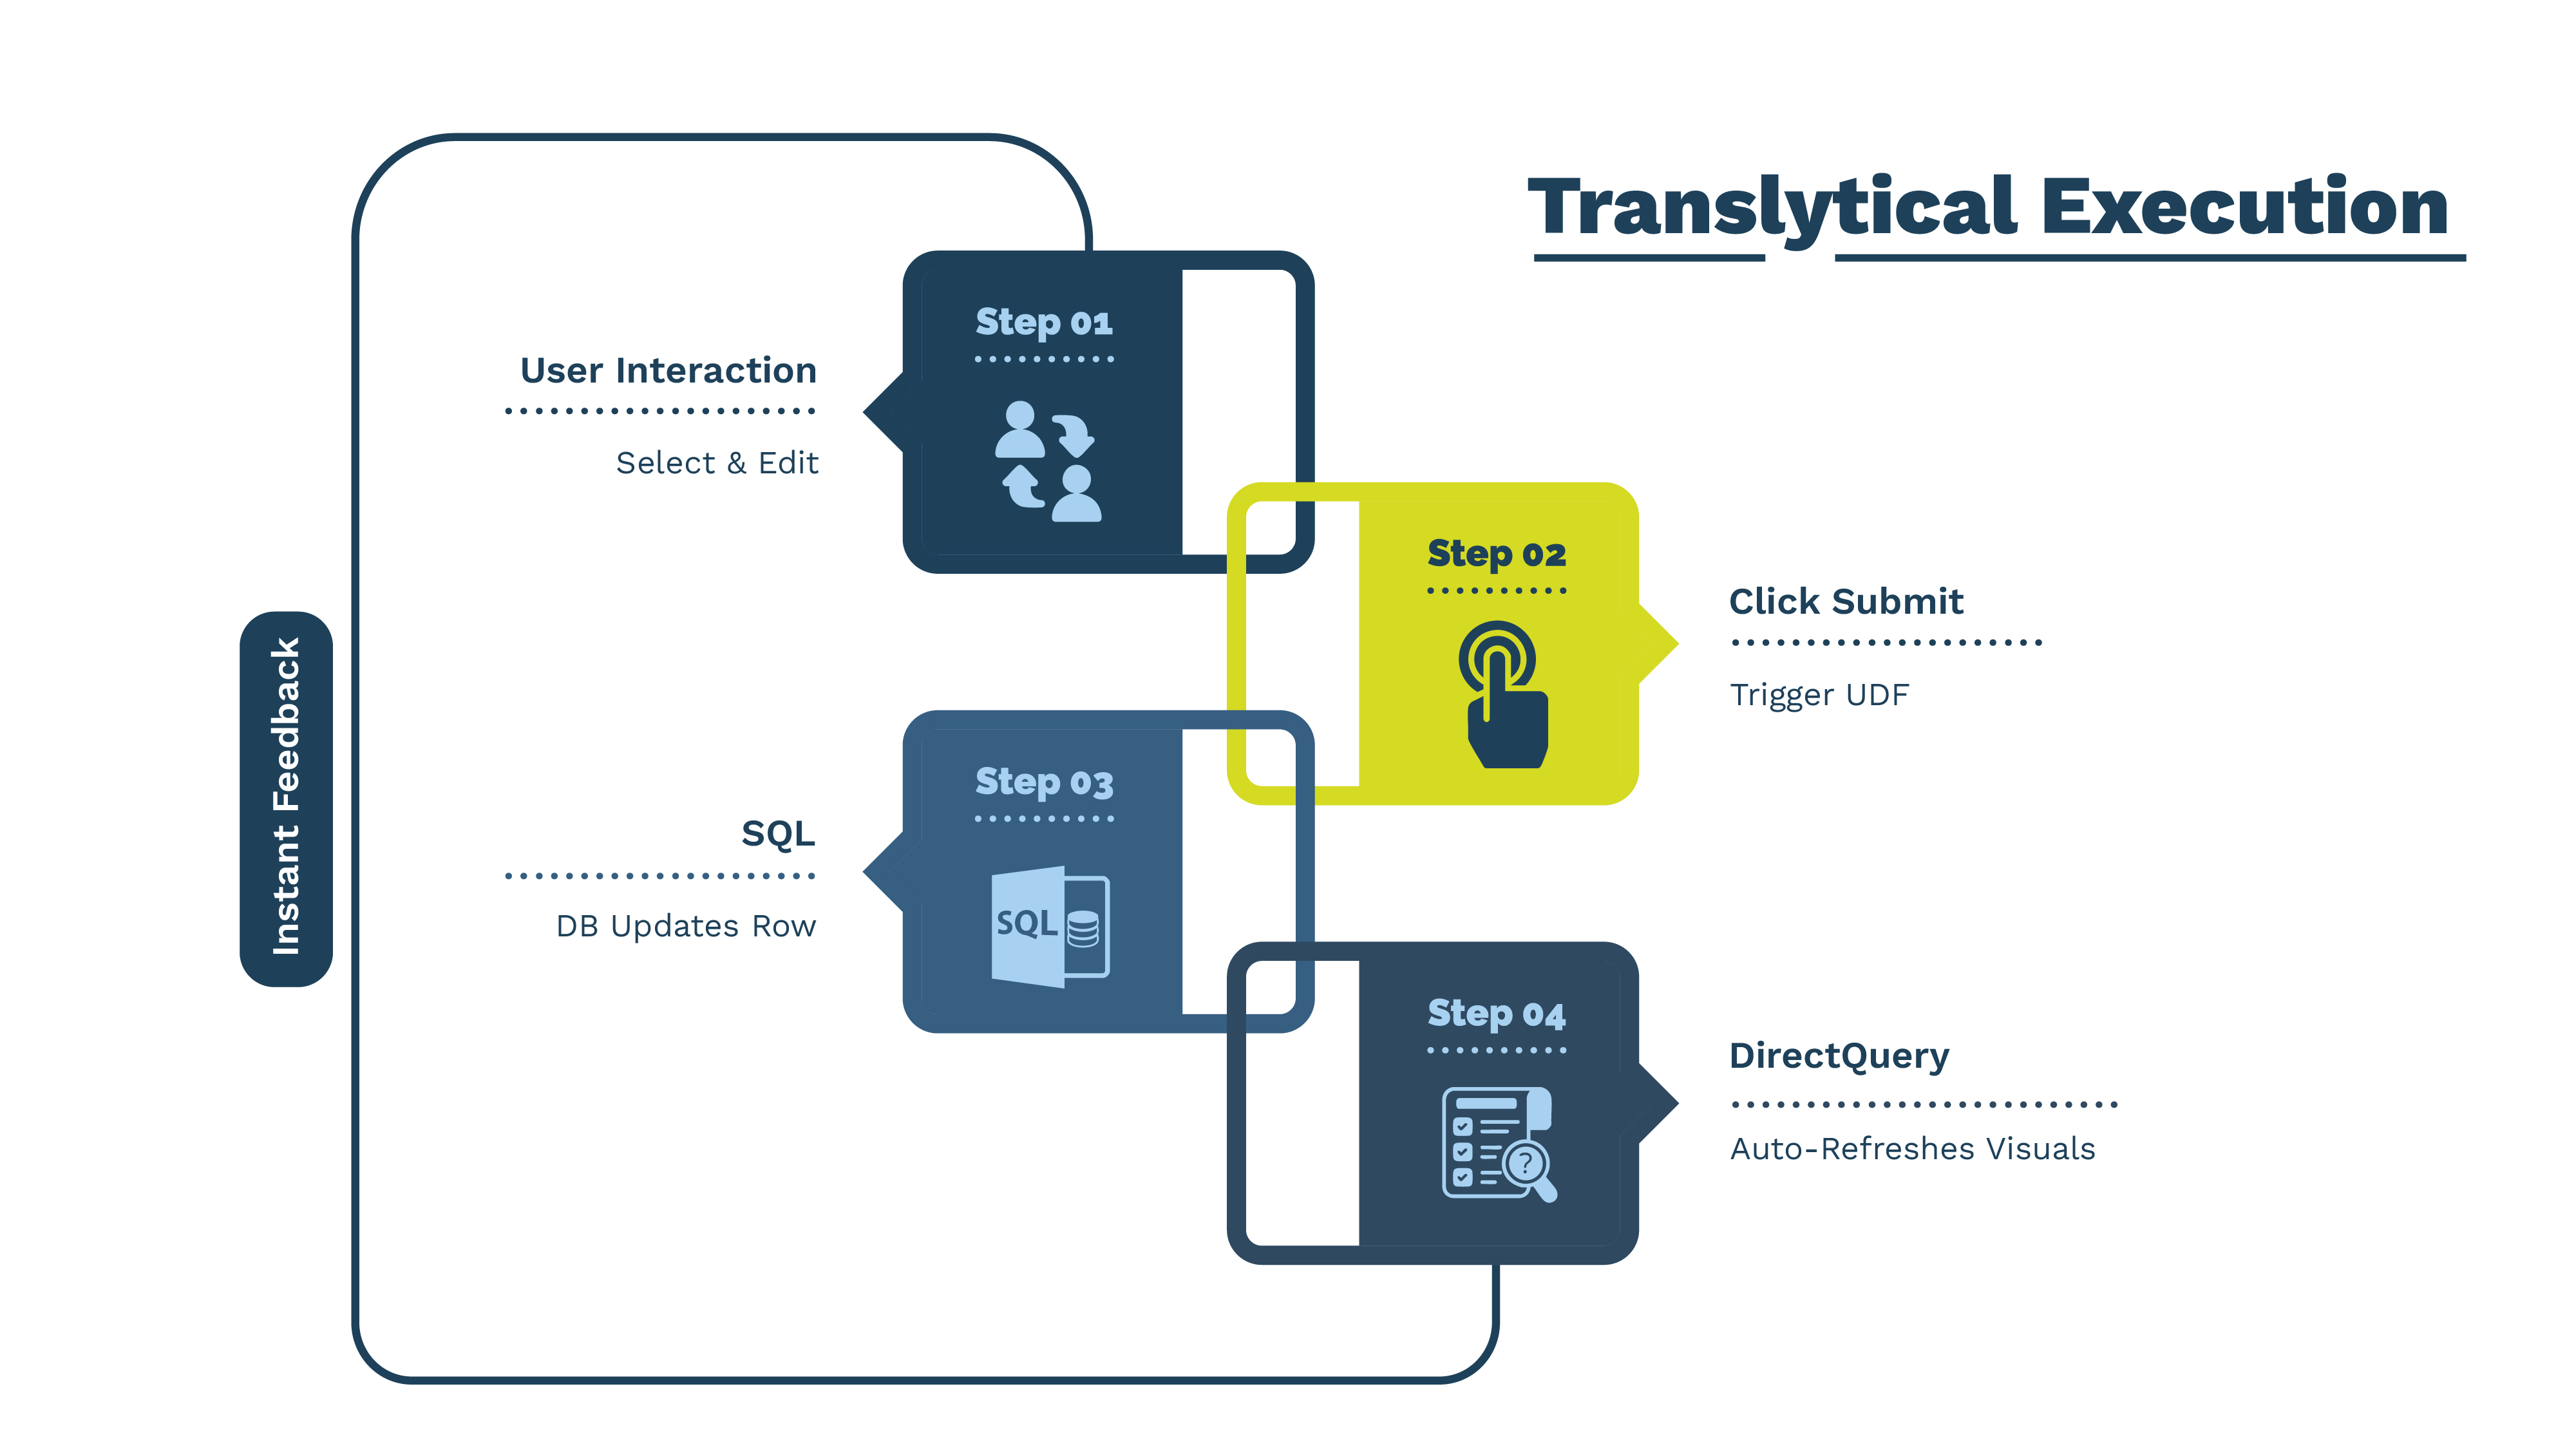
5. Run and Test
- Interact with the report: select a record, make a change, and click submit.
- See updates reflected instantly in the database and the report.
- Below is the flow, and how it works
Current Limitations
Since this is still in preview, there are some significant limitations:
- Only new preview slicers (text, button, list) are supported as inputs.
- PBIR and PBIP formats are not yet supported.
- Power BI Embedded scenarios are excluded.
- Fabric UDFs are still in preview and may have restrictions.
Beyond the Basics
Advanced users can:
- Add custom Python packages in UDFs via Fabric’s library management.
- Implement robust error handling for a smooth user experience.
- Use Translytical Flows for complex DAG orchestration, turning Power BI into a front-end for orchestrating Fabric pipelines.
Final Thoughts
Translytical Task Flows are more than a new feature; they represent a paradigm shift in how we think about Power BI. Reports are no longer read-only dashboards. They are living applications where users not only gain insights but also act on them directly.
By democratizing data editing and embedding workflows, Power BI with Translytical Task Flows pushes the boundaries of self-service analytics into the realm of self-service operations.
The future of BI isn’t just about seeing the data.
It’s about changing the data, managing the process, and driving outcomes in real time.


Related Posts.


Unified Financial Data Platform: Empowering Modern Finance with Trust, Speed, and Scale
Phani Parashuram Srinivas Bhoopathi


Microsoft API Services: The Engine Powering Digital Transformation
Shiva Pratap Singh