


Introduction
Demand forecasting is no longer just about generating predictions. Business users also want to know why a forecast changed, what drivers influenced it, and how outcomes might shift under different conditions.
Traditional forecasting pipelines typically end with dashboards or static reports. Those outputs are useful, but they rarely answer the follow-up questions decision-makers ask every day:
- Why is demand rising in one region and flattening in another?
- Which external factors are driving the change?
- What happens if rainfall drops or fertilizer prices increase?
To address this gap, we built an agentic demand forecasting solution on AWS that combines a machine learning forecasting engine with a multi-agent intelligence layer. The result is a system that allows users to query forecasts in natural language, compare trends, explore drivers, and run what-if simulations in a single workflow.
In this post, we walk through the architecture, the AWS services behind it, and the design choices that helped us move from static forecasting to interactive, explainable decision support.
Business challenge
Forecast accuracy matters, but accuracy alone is not enough. In many organizations, business users still depend on dashboards, spreadsheets, and analyst support to interpret forecasts and answer follow-up questions.
That challenge is even greater in sectors such as agriculture, where demand is shaped by multiple external signals including climate, crop acreage, input pricing, and economic conditions. A forecast number alone does not explain what is driving the change.
We wanted to build a system that could do more than predict demand. It needed to help users:
- understand forecast movement
- compare actuals with projections
- identify key drivers
- simulate alternate scenarios
Just as importantly, it had to support this through a natural language experience that felt intuitive to business users.
Solution overview
The solution is organized into three layers:
- Data and feature engineering layer – Ingests historical demand and external driver data
- Forecasting engine – Trains and serves rolling machine learning forecasts
- Agentic intelligence layer – Interprets requests, routes tasks, and assembles responses
Rather than using one general-purpose agent, we adopted a multi-agent architecture with specialized roles:
- Forecasting agent – Retrieves future demand projections
- Q&A agent – Answers questions about historical trends and business context
- Comparison agent – Compares actuals, forecasts, and scenarios
- What-if agent – Simulates changes in external drivers
- Data analyzer agent – Detects anomalies, seasonality, and volatility
- Visualization agent – Produces charts and trend views
- Supervisor agent – Routes requests and merges outputs
For example, if a user asks:
“Show me the forecast for corn for the next 3 months and plot the trend.”
the supervisor agent calls both the forecasting and visualization agents, then returns a single response. This makes the experience feel more like interacting with an intelligent planning assistant than a traditional dashboard.
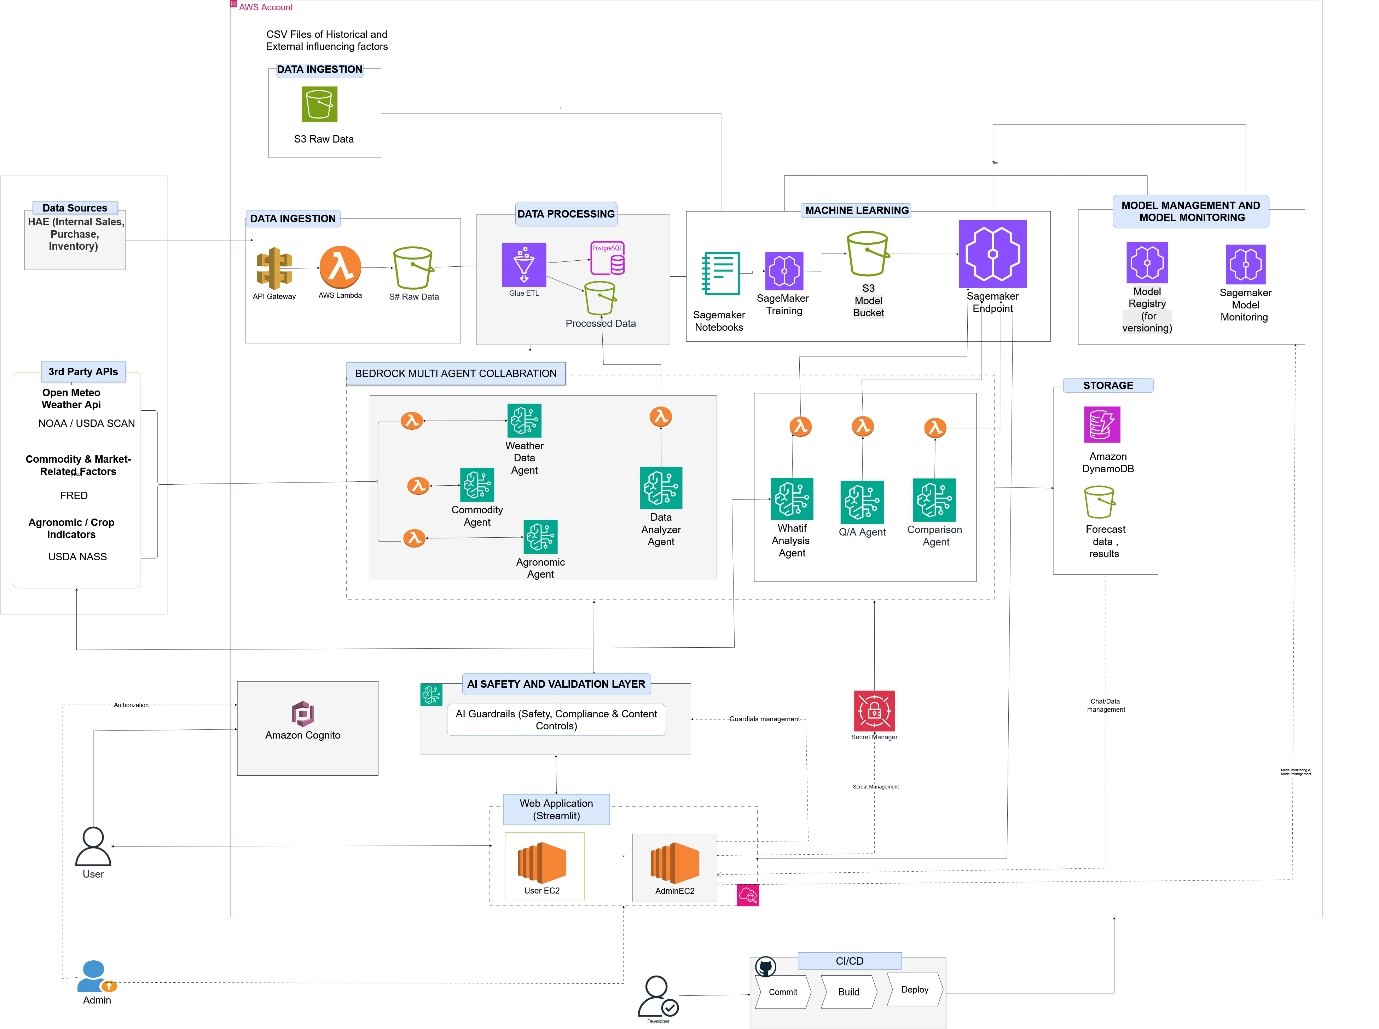
Solution architecture
The platform uses a modular AWS-native architecture:
Data ingestion and preparation
Historical demand data and external datasets are stored in Amazon S3. AWS Glue handles ingestion, transformation, and standardization to prepare model-ready datasets.
Forecasting engine
Forecasting models are trained and managed in Amazon SageMaker. We evaluated Random Forest, Gradient Boosting, and CatBoost using time-series metrics such as:
- WAPE (Weighted Absolute Percentage Error)
- sMAPE (Symmetric Mean Absolute Percentage Error)
The selected models generate monthly rolling forecasts, allowing the system to refresh predictions as new actuals arrive.
Agent orchestration
The agent layer is powered by AWS Lambda and Amazon Bedrock. Lambda handles routing and orchestration logic, while Bedrock provides foundation model capabilities for intent detection and agent reasoning.
State and result storage
Amazon DynamoDB stores session context, and Amazon RDS stores structured results such as forecast outputs, comparisons, and scenario records.
Security
Amazon Cognito provides authentication and access control, and AWS PrivateLink supports secure connectivity patterns where required.
Enriching forecasts with external drivers
Historical demand alone rarely captures the full picture, especially in agriculture and market-sensitive industries. To improve both forecast quality and explainability, we integrated external drivers across four categories:
| Category | Key Variables | Source |
|---|---|---|
| Climate | GDD, Precipitation, Heat Index | NOAA / USDA SCAN |
| Agronomic | Crop Acreage (Corn, Soy, Cotton) | USDA NASS |
| Economic | CPI, Oil Prices, Producer Indices | FRED |
| Market | Fertilizer (NH3) Prices | USDA ERS |
These signals help the model capture real-world conditions that influence demand and give users more context when they ask why a forecast changed.
Feature engineering and model training
We engineered features to improve the model’s ability to learn both temporal and cross-variable relationships, including:
- Lag features to capture prior-period momentum
- Rolling statistics to represent short-term variability
- Interaction features to model relationships between variables such as weather and crop behavior
This feature layer helped improve performance in a forecasting environment where demand is influenced by multiple interacting drivers rather than a single historical pattern.
Rolling forecasts for continuous monitoring
Instead of producing a static annual forecast, the system uses a monthly rolling forecast strategy. This reflects how forecasting is used in practice: actuals arrive over time, conditions change, and plans must adapt.
Rolling forecasts provide two key benefits:
- Adaptability – Forecasts update as new data becomes available
- Visibility – Accuracy can be tracked continuously rather than at the end of a cycle
This shifts forecasting from a one-time reporting output to an ongoing decision-support capability.
Multi-agent orchestration and guardrails
A key strength of the design is the supervisor-based routing pattern. Business requests often span multiple tasks—forecast retrieval, comparison, explanation, and visualization. The supervisor agent interprets intent, delegates work to the right specialists, and combines the result into a single response.
To support enterprise use, we also added a validation layer with:
- Prompt injection filtering
- Domain validation for forecasting-related use cases
- Safety and hallucination checks
These controls help keep responses relevant, reliable, and production-ready.
Why this architecture works
This approach proved effective for four reasons:
- Modularity – Each agent can evolve independently
- Explainability – Users can explore the drivers behind forecast changes
- Scalability – Managed AWS services reduce operational overhead
- Usability – Natural language interaction makes forecasting easier to consume
Most importantly, it helps users move beyond asking “What is the forecast?” to “Why is it changing, and what can we do about it?”
Key takeaways
- Use specialized agents to improve clarity and response quality
- Enrich forecasts with external drivers to improve accuracy and explainability
- Adopt a rolling forecast strategy for continuous monitoring
- Add guardrails to make agentic systems safer for enterprise use
- Design for modularity so components can evolve independently
Conclusion
Forecasting is no longer only a modeling problem. It is also a usability problem.
By combining machine learning with a multi-agent architecture on AWS, we built a demand forecasting solution that moves beyond static reporting. The system supports natural language interaction, scenario simulation, rolling forecasts, and explainable insights—making forecasting more accessible and more actionable for business users.
For teams operating in high-variance environments, this pattern offers a practical way to turn forecasting from a passive output into an interactive decision-support capability.

Shrina Neema
Associate Data Scientist
I enjoy building and solving problems that come with a certain level of complexity and ambiguity. This blog documents a real SAP + MCP integration journey that involved weeks of troubleshooting, multiple AWS Support discussions, and continuous debugging before the solution worked successfully end to end. I am genuinely passionate about learning not just as a professional skill, but as a mindset. Whenever something does not work as expected, I naturally feel driven to understand the root cause and see it through to completion. That curiosity and persistence are a big part of how I approach problem solving. The SAP + MCP integration covered in this blog reflects that journey well. There was no predefined playbook for the implementation, so the solution evolved step by step while addressing challenges around VPC networking, SSL certificate chains, OData pagination limits, and multi-instance state management. Every challenge along the way contributed to making the final solution more robust and reliable.

More From Author.
Related Posts.

Ensuring Data Trust: Building Scalable Data Lineage Solutions for AWS Glue
Eshan Jain Pranay Saywankar

From Reaction to Prediction: How Gen AI and Modern Data Engineering Are Reimagining AP Helpdesks
Venkata Muralidhar Vangipurapu Venkatasubba Reddy Kokatam


Demystifying SOC 2 Compliance: Why It Matters for Your AWS Cloud Environment
Mahipal Kirupanithy Shashi Kant


Data Mesh with Amazon DataZone: Rethinking enterprise data without chaos
Ankur Jain Kshitij Trivedi Uday Sharma

Transforming Data Discovery: Unlocking the Power of AWS DataZone for Enhanced Marketplace Insights
Ankur Jain Ashish Maheshwari

Mastering API Access Control: A Deep Dive into AWS Verified Permissions
Durgesh Vaishnav Vividh Dave

Is Your Business Ready for GraphQL? Discover How AWS Can Supercharge Your Data Access Needs with GraphQL!
Durgesh Vaishnav Ramesh Suryaneni

Securing Your EC2 Instances with Security Groups: Best Practices and Common Errors
Punna Balaji Prudhvi Tej

How YASH protects our customers across the AWS cloud journey
Ashish Maheshwari Mahipal Kirupanithy