


Enter the world of data visualization with the ultimate JavaScript API library, Chart.js. We will explore the incredible features and capabilities of Chart.js that I enjoyed discovering and integrating during a recent Azure Dashboard Web Portal project. Whether you’re a developer looking to enhance your data visualization skills or a business seeking robust charting solutions, Chart.js is for you.
Chart.js is a robust tool that offers an array of chart types, including bar charts, pie charts, doughnut charts, and area charts, to name just a few. With its seamless integration and extensive customization options, this API library empowers developers to create visually stunning charts with large datasets, rendering them effortlessly on an HTML5 canvas.
What sets Chart.js apart is its flexibility and compatibility. Regardless of the JavaScript framework you’re using, whether React, Angular, or any other, Chart.js seamlessly integrates into your project, making it the ideal choice for developers across the board.
But it doesn’t stop there. Chart.js goes beyond the basics, offering a range of plugins and features to take your data visualization to the next level. Want to add annotations, enable zooming, or incorporate drag-and-drop functionalities? Chart.js has got you covered. Its vast array of customizable options empowers you to tailor your charts to suit your needs.
One of the standout qualities of Chart.js is it is loyal to the open-source community. As an open-source library released under the MIT license, Chart.js encourages collaboration and innovation, making it accessible to developers worldwide.
Pre-requisites:
Before diving further into Chart.js, it’s essential to have a solid foundation. Familiarity with JavaScript, JQuery, object-oriented programming concepts, and arrays will significantly enhance your experience. A good grasp of HTML5 and CSS will ensure smooth integration and seamless visualization.
Now that we’ve laid the groundwork, here’s Chart.js, transforming how we interpret and present information. Let’s get started!
Installation:
Chart.js can be installed and referenced in our application using these ways:
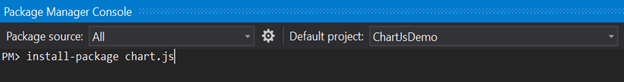
Nuget Package Manager – npm install chart.js
CDN – add link reference to one of the following URLs:
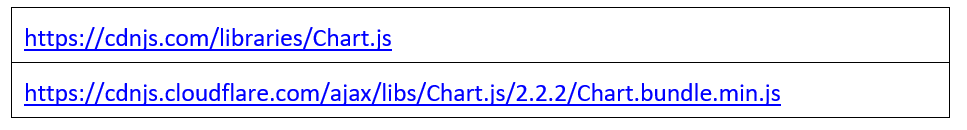
- jsDelivr – https://www.jsdelivr.com/package/npm/chart.js?path=dist
- GitHub – Download the latest Chart.js version or clone the repository
Chart Types:
Chart.js provides various chart types, and we will explore the most frequently used chart types, viz., the following 3 charts with examples:
- Bar Chart
- Pie Chart
- Doughnut Chart
1. Bar Chart:
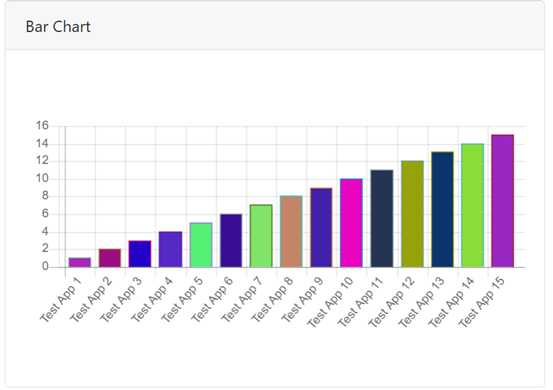
Bar Chart represents data in vertical lines in the x and y axis rendered on the HTML 5 canvas. It is the most frequently used chart to compare data sets and trends.
JS Configuration:
The following code snippet depicts the Bar Chart configuration structure in Java Script:
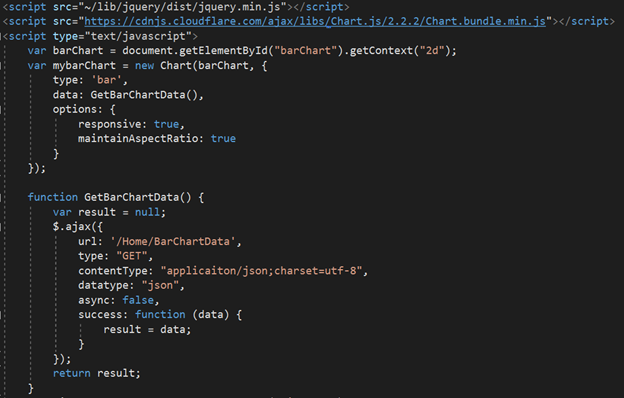
- The type: ‘bar’ denotes chart type is a bar chart
- The dataproperty of a dataset can be in different formats. Ex. Object[], JSON format data etc.,
- The options property denotes various options to be specified for different sections. e.g., options:{responsive: true,
- maintainAspectRatio: true}
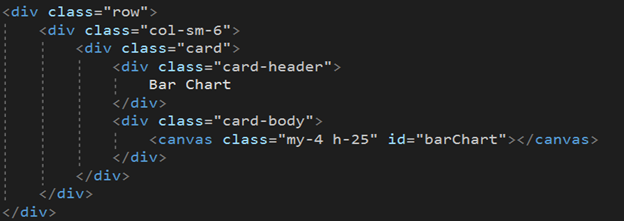
UI:
Add the following canvas tag in your HTML view page index.cshtml.
Data Source:
Add the below code snippet, as shown in the screenshot, in your controller action method to generate a data source for the bar chart.
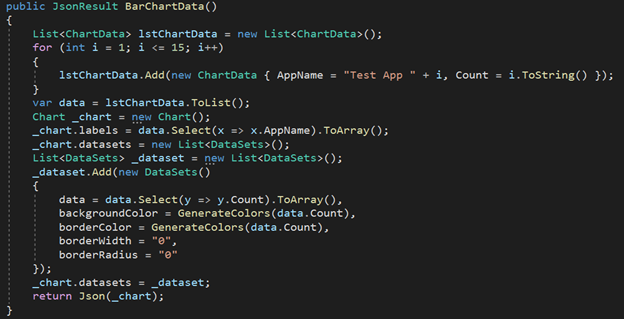
In this example, we generate some test data in JSON format to bind the same to the Bar chart.
Output:
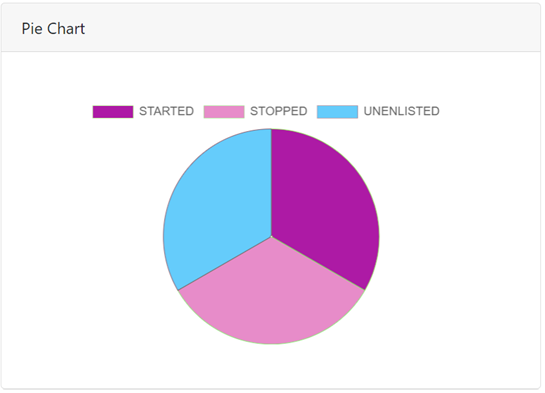
2. Pie Chart:
The Pie chart is used to represent data in segments and proportions.
JS Configuration:
- The type: ‘pie’ denotes chart type is a pie chart
- The dataproperty of a dataset can be in different formats. Ex. Object[], JSON format data etc.,
- The options property denotes various options to be specified for different sections. e.g., options:{
responsive: true,
maintainAspectRatio: true
}
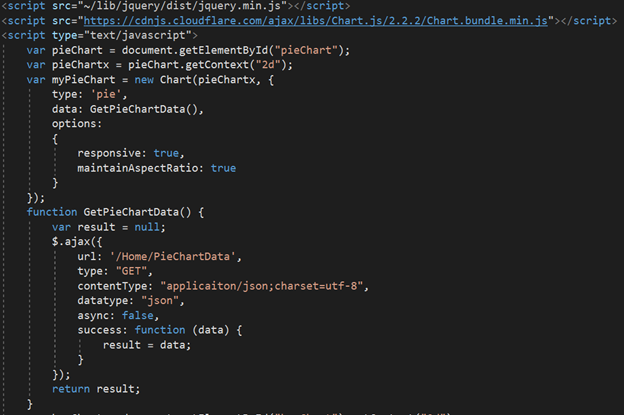
The following code snippet denotes the Pie Chart configuration structure in Java Script:
UI:
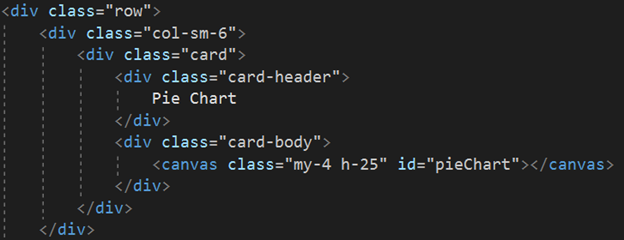
Add the canvas tag in your HTML view page index.cshtml.
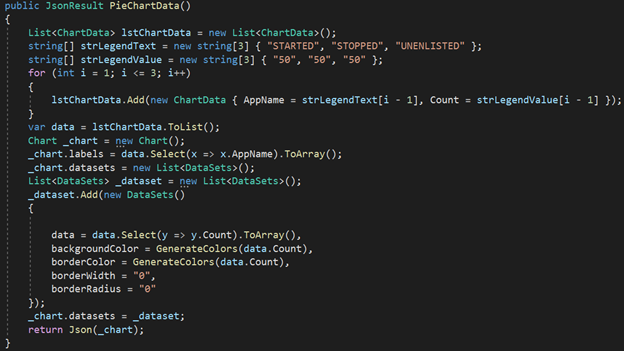
Data Source:
Add the code snippet shown in the screenshot in your controller action method to generate the data source for the pie chart.
Output:
3. Doughnut Chart:
The Doughnut chart is used to represent data in segments and proportions. The difference between Pie and Doughnut is the default cutout value is ‘0’ for the Pie chart and ‘50%’ for the doughnut chart to equate the portion of the inner cutout, and the remaining properties are the same in chart.js.
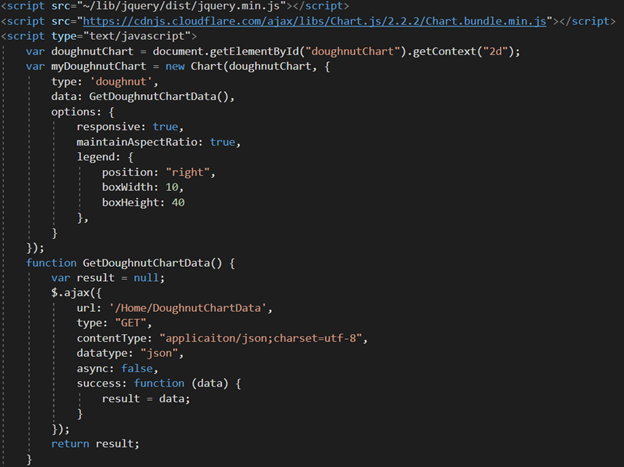
JS Configuration:
- The type: ‘doughnut’ denotes chart type is a doughnut chart.
- The dataproperty of a dataset can be in different formats like object array or JSON data.
- The options property denotes various options to be specified for different sections. e.g., options:{ responsive: true,
maintainAspectRatio: true,
legend: { position: “right”
boxWidth: 10,
boxHeight:40 }
}
The following code snippet denotes the Doughnut Chart configuration structure in Java Script:
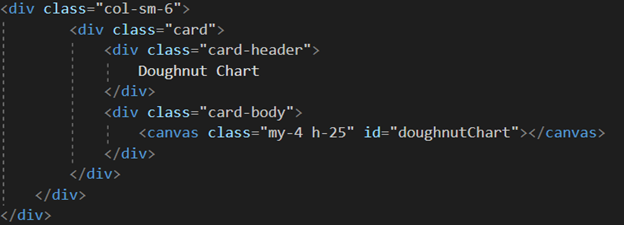
UI:
Add the following canvas tag in your HTML view page index.cshtml.
Data Source:
Add the below code snippet, as shown in the screenshot, in your controller action method to generate a data source for the doughnut chart.
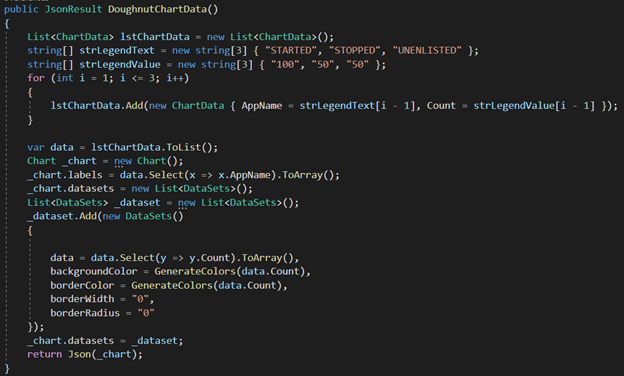
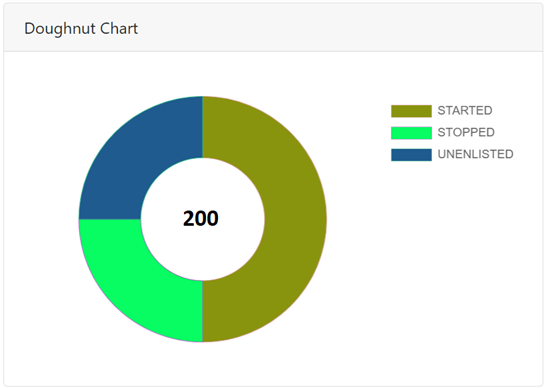
Output:
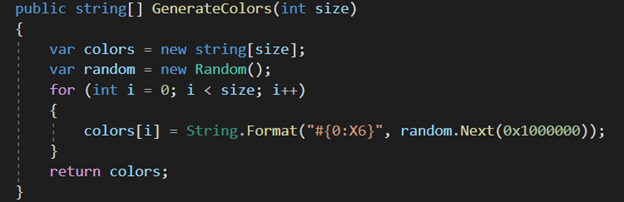
The following code snippet depicts the custom function to generate random and dynamic HTML web colors for corresponding chart types based on the data length provided.
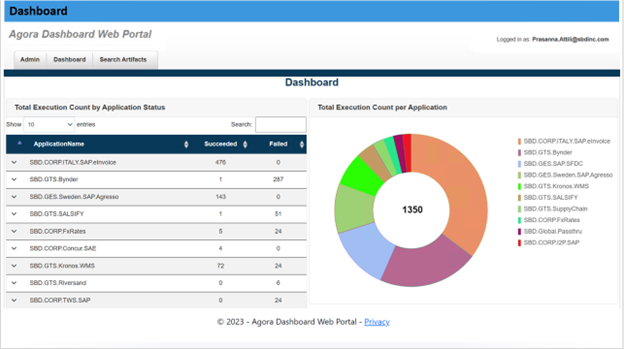
Real-Time Integration:
The following screenshot depicts a real-time scenario of a typical Dashboard in Azure Web Portal, which shows Chart.js integration for Azure Logs data visualization in the form of a doughnut chart.
Conclusion:
In this blog, we have covered the most frequently used chart types like bar charts, pie charts and doughnut charts and their primary feature for data visualization using Chart.js API library.
For more detailed documentation to explore the Chart.js API, please visit the official website: https://www.chartjs.org/docs/latest/