

What is Smart Business Cockpit?
Smart Business Apps set up a new working model combing real-time insights with analytics and transactional follow-up activities allowing better faster decisions. SAP Smart business cockpits analogous to a battlefield where key stakeholders such as a strategic buyer, a sales operations manager, a warehouse manager, a project controller or a financial manager would go to war on a daily basis to resolve conflicts affecting their businesses.
SAP Smart business cockpits are based on standard set of KPI’s. They come with a modeler for KPI definition, authorization, and drill down definitions. SAP Simple finance pre-dominantly delivers many of the KPI’s based on this.
Benefits:
- Ability to analyze business KPIs in real time and take immediate action
- Unified look & feel, giving the best User Experience
- Role-based authorization, simplifying the security implementation
- SAP Smart Business Apps are real-time analytical applications that combine operational and strategic key figures from SAP Business Suite in a single cockpit
Capabilities:
- Overview of most important key figures in Contract Accounting for highly automated processes
- Analyze, drill down, filter, navigate down to single business partners with open items, trigger follow-up activities
Features for Business Users:
- KPI-tiles on the Fiori Launchpad providing quantitative information.
- KPI- Details with various drill-down by selected dimensions.
- Personalization and Save as tile of KPI details.
- Modifications-free adaption of pre-defined KPI.
KPI Tile Configuration in S/4 HANA Cloud
Log into Fiori Launch Pad and select create KPI Tile
Create KPI:
We can use this to create Key Performance Indicators (KPIs).
Fill the details,
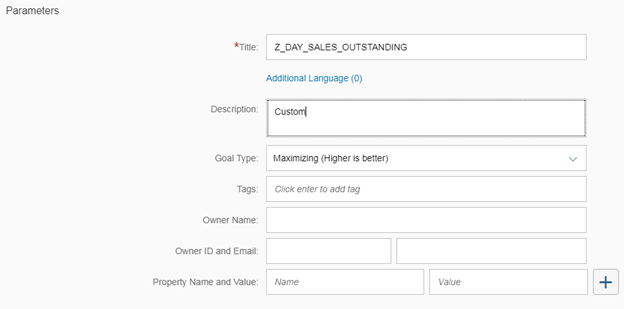
Click on Active and add Evaluation
Create Evaluation:
Activated the KPI and creating an evaluation, here describe a particular selection of the KPI data, the targets, and thresholds that are relevant, along with some additional information.
Provide details,
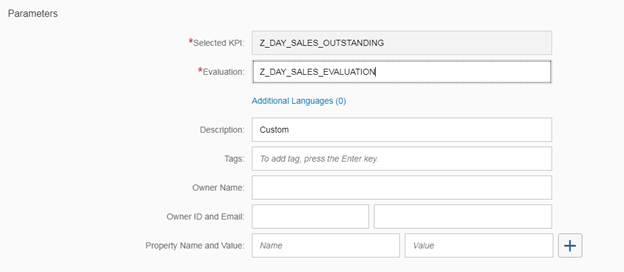
Provide threshold values (optional) and Click on Active and configure Tile.
Create Tile:
Configure tiles for activated evaluations as the starting point for further analysis of a KPI. You can select different KPI as below,
(Numeric Tile, Comparison Tile, Trend Tile, Actual vs Target Tile, Comparison Tile – Multiple Measures, Blank Tile and Dual Tile)
Select required tile type:
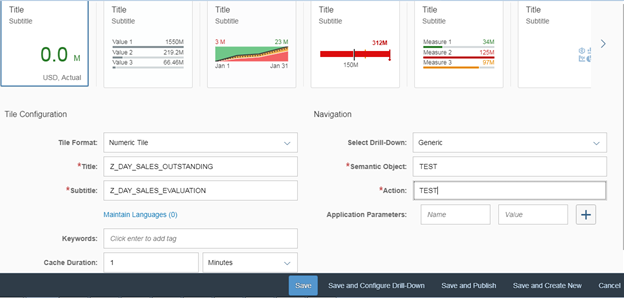
Save and Configure Drill-Down
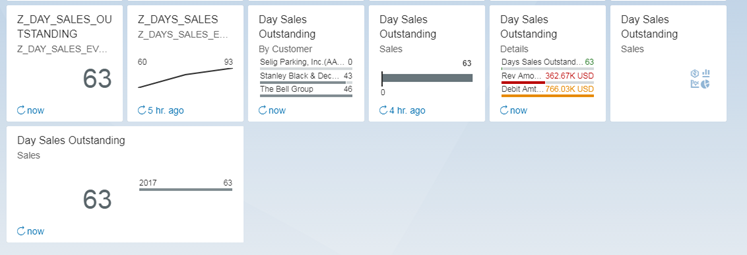
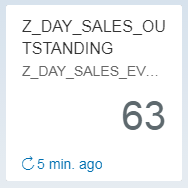
Numeric Tile: Data is present in a Numeric format. The aggregate value of the KPI main measure (like Day Sales Outstanding, Revenue, Margin. Etc)
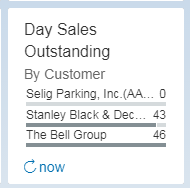
Comparison Tile: Compare TOP KPI values based on dimensions like Customer, Region, etc.
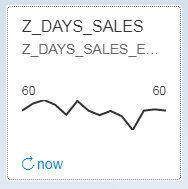
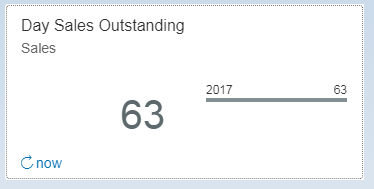
Trend Tile: In this tile, you select a date time dimension, and you can see the trend of your business concerning the dimension was chosen.
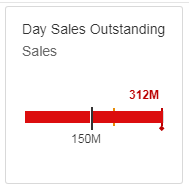
Actual vs. Target Tile: Data is presented graphically as a bullet chart shows the current value of the KPI against the target value and its thresholds.
Comparison Tile – Multiple Measures: It is similar to Comparison Tile but here you can select multiple key figures, maximum of three measures and minimum 2 measures.
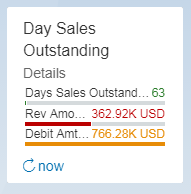
Dual Tile: In this tile Dual tile the left side shows the KPI measure in numeric format and left side shows any one of the other tile supported by Smart Business.
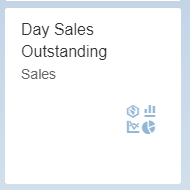
Blank Tile: In this tile displays title and subtitle.
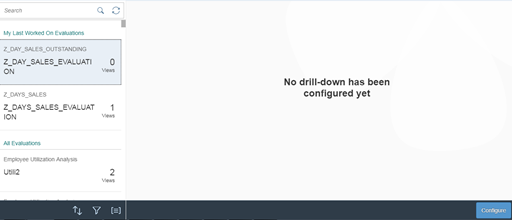
In runtime on KPI, you can see the key indicator of business in various visualizations. In Drop-down to analyze the business detail.
Configure Drill-Down:
You can use this configure charts, different views, filter and associated KPIs for an effective evaluation.
Click on Configure
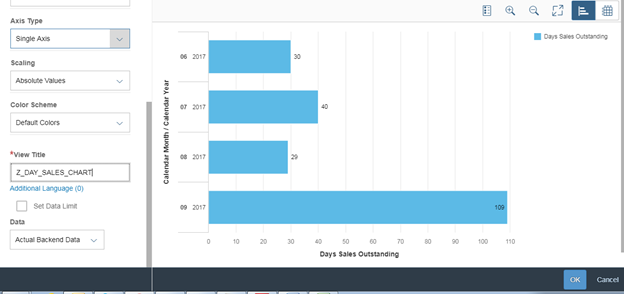
Select Dimension and Measure from Data Source.
Provide details under View title section
Click on OK
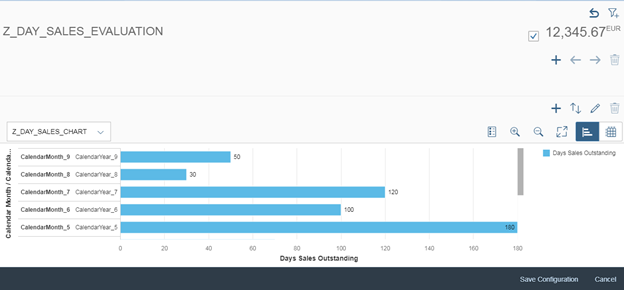
Click on Save and configure
Note: If you are unable to see Create KPI Tile in Fiori Launch Pad then roles are missing for your ID
Watch the Webcast to get more insights and overview about SAP S/4HANA – Product, License, infrastructure and Deployment options.
https://www.yash.com/webinar/s4hana-product-deployment-options/
Chandrasekhar. K -SAP BI Consultant @YASH Technologies


Related Posts.


SAP GROW Fast: Launch SAP Cloud ERP within 90 Days
Jacinto Arauz Jai Prakash Nethala


Outgrowing Your ERP? How Australian Businesses Can Go Live in 8–10 Weeks
Jai Prakash Nethala


The SAP GROW Story: What Changed, What Stayed, and What It Means for Growing Businesses
Jacinto Arauz Jai Prakash Nethala
Connecting AI Agents to SAP S/4HANA via MCP
Shrina Neema


From Silos to Smart Systems: Why MEA Healthcare Needs Connected Intelligence
Murali Krishna Chilla