


What is Inventory Optimization ?
Inventory planning is a continuous optimization effort for organizations, vital for smooth supply chain operations amidst uncertainty. It faces hurdles like demand variability, supply chain complexity, and cost management. Overcoming challenges such as inconsistent tracking and stock imbalances is critical to maintaining customer satisfaction.
Poor Inventory Optimization leads below Business nodes Suffer.
- Too Much Inventory – Finance Department
- Not enough Inventory – Customers
- Right Inventory, Wrong Place or Wrong time – Supply Chain Planners
The below image is a Simple Supply chain network in which you can view different nodes of supply chain and consider which location should be your safety stock node.
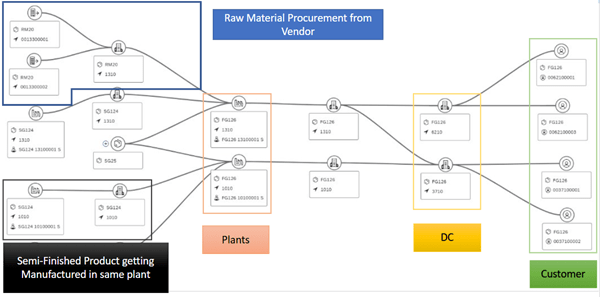
- Procurement: Procurement with respect to inventory planning, is the crucial process of acquiring the necessary materials and goods from suppliers to meet the demands identified in the inventory plan. It’s the execution arm that ensures the inventory levels planned are actually achieved and maintained.
- Manufacturing: Manufacturing in supply chain planning, with respect to inventory planning, is the process of converting raw materials and components into finished goods in a way that aligns with the planned inventory levels and customer demand. It’s the “make” function within the broader supply chain, and its effectiveness directly impacts the success of inventory planning.
- Distribution: Distribution with respect to inventory planning, is the strategic process of managing the movement and storage of finished goods from the manufacturing point to the end customers, while considering the optimal inventory levels at various points in the distribution network. It’s about getting the right products to the right places at the right time, with the right amount of inventory to meet demand efficiently and cost-effectively.
Why your business may need Inventory Optimization by SAP IBP ?
Inventory optimization in SAP Integrated Business Planning (IBP) offers a compelling business use case for companies striving to balance customer service levels with efficient capital utilization. Imagine a global manufacturer of industrial components facing these challenges:
- High Inventory Costs: Significant capital is tied up in warehouses across different regions, leading to high carrying costs and the risk of obsolescence for slow-moving items.
- Stockouts and Lost Sales: Despite high overall inventory, localized stockouts occur frequently, frustrating customers and resulting in lost sales opportunities.
- Complex Supply Chain: The company sources raw materials globally, manufactures in multiple plants, and distributes through a network of regional distribution centers, making it difficult to determine optimal inventory levels at each stage.
- Demand Volatility: Customer demand fluctuates due to economic conditions, project timelines, and seasonal factors, making accurate forecasting challenging.
- Lack of Visibility: Disparate systems and spreadsheets provide a fragmented view of inventory, hindering effective decision-making.
SAP IBP Inventory Optimization provides a solution by:
- Gaining End-to-End Visibility: IBP integrates demand forecasts, supply plans, and inventory data into a single platform, providing a holistic view of inventory across the entire supply chain. This eliminates data silos and enables a comprehensive understanding of inventory positions.
- Optimizing Inventory Targets: Utilizing sophisticated statistical algorithms and machine learning, IBP analyzes historical demand patterns, lead times, variability, and desired service levels to calculate optimal inventory targets at each stocking location and for each product. This moves beyond simple rule-based approaches to a more data-driven methodology.
- Considering Multi-Echelon Inventory: IBP understands the interdependencies within the supply chain. It optimizes inventory levels not just at individual locations but across the entire network, considering the impact of upstream and downstream inventory decisions. This helps avoid localized optimizations that might negatively affect the overall supply chain.
- Incorporating Demand and Supply Variability: The solution accounts for the inherent uncertainty in demand and supply. By analyzing forecast accuracy and lead time variability, IBP recommends safety stock levels that buffer against unexpected fluctuations, ensuring desired service levels are met.
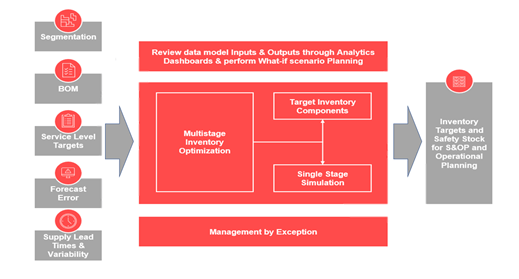
- Simulating “What-If” Scenarios: IBP allows planners to simulate the impact of different inventory policies, service level targets, or supply chain configurations. This enables them to proactively assess trade-offs between inventory costs and customer service and make informed decisions.
- Improving Collaboration: The unified platform facilitates better communication and collaboration across different departments, such as sales, marketing, supply chain planning, and finance. This ensures alignment on inventory strategies and targets.
The Business Value and Use Case Realization:
By implementing SAP IBP Inventory Optimization, the industrial component manufacturer can achieve significant business benefits:
- Reduced Inventory Costs: Optimized inventory targets lead to lower overall inventory levels, reducing carrying costs, warehousing expenses, and the risk of obsolescence.
- Improved Customer Service: Data-driven safety stock calculations minimize stockouts, leading to higher order fulfillment rates and improved customer satisfaction.
- Increased Revenue: By avoiding lost sales due to stockouts and improving customer loyalty, the company can drive revenue growth.
- Enhanced Supply Chain Efficiency: Better visibility and optimized inventory flow reduce bottlenecks and improve the overall efficiency of the supply chain.
- Better Capital Allocation: Reduced capital tied up in excess inventory can be reinvested in other strategic initiatives.
- More Agile Response to Market Changes: The ability to simulate scenarios allows the company to quickly adapt its inventory strategy to changing market conditions or demand patterns.
In essence, the business use case for inventory optimization in SAP IBP is about transforming inventory management from a reactive, cost-center function to a strategic asset that drives profitability, enhances customer satisfaction, and builds a more resilient and efficient supply chain. It empowers businesses to make smarter inventory decisions based on data and insights, ultimately leading to a significant competitive advantage.
What are the Main Elements of Inventory Optimization?
To enhance supply chain efficiency, managers must approach supply chain inventory optimization from multiple perspectives. Though supply chain inventory optimization covers many aspects, it typically involves three crucial factors that must be effectively addressed.
The main elements of supply chain inventory optimization are:
Demand Forecasting
- Precise demand forecasting plays a vital role in supply chain inventory optimization solutions. The approach to demand and supply chain forecasting depends on multiple factors, such as product type, service nature, industry category, and product life cycle stages.
- While some forecasting techniques lean on past demand, others require sales team estimates.
- A deep understanding of the inventory volume and product life cycle plays a crucial role in effective demand forecasting required for optimizing demand and discovering the position of SKUs in the life cycle.
Inventory Strategy
- Managing product inventory requires thoroughly comprehending which products to stock, when, and how many. To optimize this process, many companies employ ABC analysis to classify products based on their annual consumption value to determine optimal quantities.
- Additionally, identifying the appropriate safety stock to accommodate changes in demand or unexpected disruptions is crucial.
Stock Replenishment
- Stock replenishment starts with determining when and how much each item needs to be reordered. Managers need to consider each supplier’s lead time and production cycles, as well as the reliability of their deliveries.
- Supply chain managers also have to monitor goods currently in transit, not just those in stock at the warehouse. Both factors are essential to ensuring smooth operation and meeting customer demand.
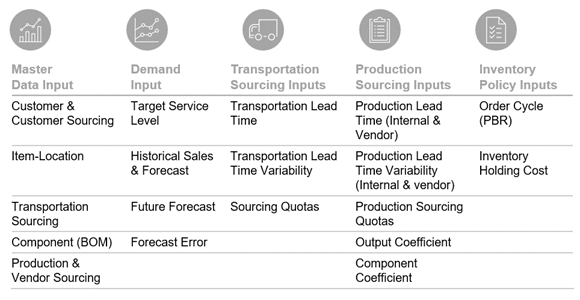
SAP IBP Inventory Planning – Into SAP IBP Input/Output
Steps to Perform IO in SAP IBP:
- Reference Planning area could be taken from SAPIBP1
- Pre-requisite Demand Planning Cycle should have been completed.
- Copy Operator for IO Sales- Actuals Qty & IO Demand Forecast – Ex-Post Forecast Should be created.
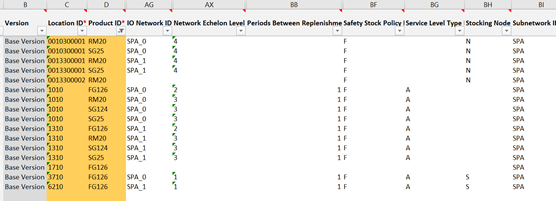
Step 1 : Master data Maintenance related to IO
- Service Level Type Indicator : Afor available in full (non-stockout probability), which calculates the service level as the number of customer orders you plan to service in full as a proportion of the total orders received, Or F for fill rate, which calculates the service level as a ratio of the total number of orders to be delivered by orders received over a given period.
- Stocking Node Type Indicator : Sfor stocking node (default), N for non-stocking node
- Safety Stock Policy Indicator : Ffor first come, first serve, where all demand streams get the highest service level (default if missing or non-supported letter), D for divide, which calculates safety stock for each demand stream independently and adds them up (no pooling) I for independent demand only, which calculates safety stock for independent demand streams only (for example, plants with limited capacity)
- Periods Between Review (PBR)defines the number of periods (in weeks, but can be expressed as decimals for sub-weekly intervals) between reviews for replenishment at a specific location-product combination.
- Units of PBR: PBR values are typically expressed in weeks, but can also be expressed in decimals to represent sub-weekly intervals (e.g., 0.14 for 1 day).
- Example of PBR: If PBR is 1, it means that the inventory is reviewed and replenished every week. If PBR is 0.2857, it means that the inventory is reviewed and replenished every 2 days.
- Master Data type Demand Stream need to be maintained and Target Service level below 1 (Because if we maintain TSL as 1 then Safety stock calculated are really high (beyond the bounderies we can say))
- Units of Target Service Level:Customer service level at a location product.If this value is null or missing for a location product with future forecasted demand, inventory operators use a default value of 50% (0.5).for combination of customer group A and SKU X maintain a high TSL between .85 to .95for combination of customer group B and SKU Y maintain a moderate TSL between .75 to .90
for combination of customer group C and SKU Z ( where most of the customer and SKU will fall) maintain a TSL between .75 to .80.
And Other Attribute as Key figure Maintenance: TRATIO, PRATIO, OUTPUTCOEFFICIENT, COMPONENTCOEFFICIENT, PLEADTIME, TLEADTIME
Output Attribute are IO Network ID and Network Echelon Level which identifies the number of nodes upto the Stocking location (DC)
Step 2 : Execute Copy Operator for Actuals qty adj (IO Sales) and Ex-Post forecast (IO Demand Forecast) through Copy operator (Past period)
Execute Copy Combined final Demand KF (Future) in IO Demand Forecast through Copy Operator,
These two copy operator are critical steps which helps measure the Demand variability in IO, which derives from Actual vs Forecasted difference for the selected horizon.
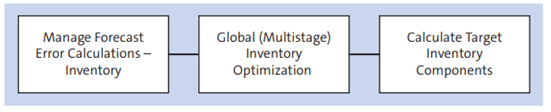
Step 3: Execute the forecast error run to calculate any forecast error from Input KF ( IOSALES & IODEMANDFORECAST)
Assumption : IO_FORECASTERROR_CV Profile already configured.
You can use the Forecast Error operator to run calculations based on historical data to determine the accuracy of your forecasted demand. The results of these calculations are used as the primary demand inputs for running inventory optimization.

Step 4: Execute IO Operator ( Global Multistage Inventory Planning)
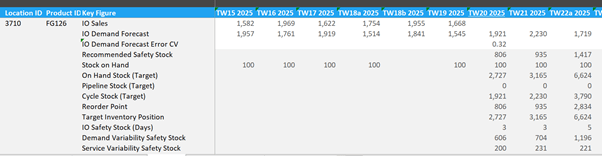
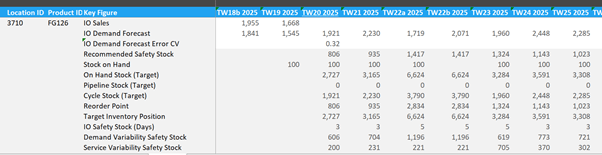
Key Outputs Obtained as a result of Inventory Planning & Optimization:
- Average Service Level: Weighted average of customer and internal service levels.
- Propagated Demand Mean: The Demand Propagated from the customer facing nodes to the Upstream nodes in the Supply chain.
- Recommended Safety Stock: Stock Level Recommended by the Optimizer to capture variability in demand, supply and Service levels.
- Demand Variability Safety Stock: Safety stock due to demand variability accounts only for the single-stage demand variability, which is calculated based on the sum of demand variabilities during exposure (PBR + LT) periods. Therefore, the drivers of safety stock due to demand variability are PBR, lead time (LT), forecast error, and service level requirement.
- Note: Lower forecast accuracy can lead to a higher safety stock requirement & In addition, the higher desired service level, the longer the lead time and review cycle and the higher the safety stock requirement
- Supply Variability Safety Stock: Safety stock due to supply variability accounts for the uncertainty in supply due to lead time variability. To calculate supply variability safety stock, a safety stock amount based on total demand variability and supply variability is calculated first, then demand variability safety stock is subtracted from it.
- Service Variability Safety Stock: Service variability safety stock is defined as the additional amount of safety stock needed on top of demand variability safety stock plus supply variability safety stock to cover for service variability. Therefore, it’s calculated as the difference between total recommended safety stock and the sum of demand variability safety stock and supply variability stockCycle
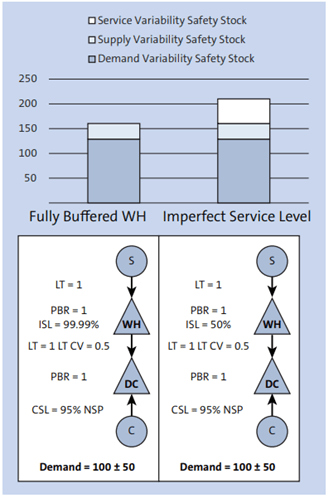
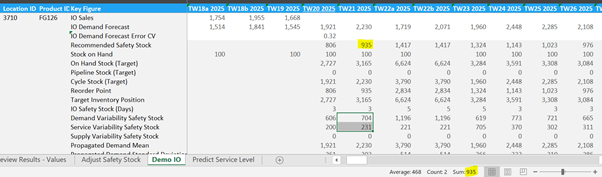
Recommended Safety Stock is Addition of Demand Variability + Service Variability + Supply Variability ( Blank Because no data available for actual deliveries)
Step 4 : Execute Calculate Target Inventory Component to Calculate all the Target Key figures and Re-Order Point.
- Stock Target: Propagated demand mean over the length of PBR.
- On Hand Stock(Target): Stock on Hand – Safety Stock + Cycle stock.
- Target Inventory Position: Propagated demand mean + safety stock over the length of lead time and PBR.
- Reorder Point: Propagated demand mean over length of lead time and lead time variability.
SAP IBP IO advantages and disadvantages of inventory optimization in supply chain planning:
Advantages
- Reduced Inventory Costs:
- Lower holding costs (storage, insurance, utilities).
- Minimized risk of obsolescence and spoilage.
- Less capital tied up in excess stock.
- Improved Cash Flow:
- Working capital is freed up for other investments.
- Faster inventory turnover.
- Reduced need for discounting to clear excess stock.
- Enhanced Customer Satisfaction:
- Fewer stockouts and backorders.
- Shorter lead times and faster delivery.
- Increased order fulfillment rates.
- Increased Revenue:
- Avoidance of lost sales due to stockouts.
- Improved customer loyalty and repeat business.
- Operational Efficiency:
- Streamlined warehouse operations (receiving, storage, picking, packing, shipping).
- Reduced manual effort and errors.
- Better resource allocation.
- Better Decision-Making:
- Data-driven insights into demand patterns and inventory performance.
- Ability to simulate “what-if” scenarios.
- Improved forecasting accuracy.
- Enhanced Supply Chain Resilience:
- Better ability to adapt to demand fluctuations and supply disruptions.
- Optimized safety stock levels to buffer against uncertainty.
- Improved Collaboration:
- Enhanced communication and alignment across different departments and supply chain partners.
- A shared understanding of inventory strategies and targets.
- Greater Sustainability:
- Reduced waste from obsolete inventory.
- Potentially lower energy consumption in warehousing due to optimized space utilization.
Disadvantages:
Complexity:
- Can be complex to implement and manage, especially for businesses with diverse product lines, multiple locations, and intricate supply chains.
- Requires specialized knowledge and expertise.
Data Dependency and Accuracy:
- Relies heavily on accurate and timely data. Poor data quality can lead to suboptimal results.
- Requires integration with various systems (ERP, WMS, etc.).
Potential for Over-Optimization:
- Aggressive inventory reduction without fully considering demand variability and supply chain risks can lead to more frequent stockouts.
Resistance to Change:
- May face resistance from employees accustomed to traditional inventory management practices.
Need for Continuous Monitoring and Adjustment:
- Inventory optimization is not a one-time project. It requires ongoing monitoring, analysis, and adjustments to remain effective.
Vulnerability to Unexpected Events
- While it improves resilience, extreme and unforeseen events (natural disasters, major supplier failures) can still disrupt optimized inventory levels.
Potential for Increased Transportation Costs:
- In some cases, very lean inventory strategies might lead to more frequent, smaller shipments, potentially increasing transportation costs.
In conclusion, while inventory optimization offers significant advantages in terms of cost savings, efficiency, and customer service, businesses must carefully consider the potential disadvantages and ensure they have the necessary resources, expertise, and commitment for successful implementation and ongoing management.


More From Author.
Related Posts.


SAP Infrastructure in the NY–NJ Pharma Corridor
Akhilesh Sodhani Parvez Ali


NeoLoad for SAP: Best Practices for Performance & Volume Testing
M. Sreekanth Vishvambhar Rushi


Accelerating Time-to-Value: Why Businesses Choose SAP Cloud ERP
Jacinto Arauz Paola Siri

How Australian HR Leaders Can Build High-Value, High-Trust People Systems in 2026
Saratchandra Panganamamula

The AI-First ERP: Future-Proofing Your Business with SAP Cloud ERP – Public
Paola Constanza Siri


SAP Business Data Cloud Essentials: What You Need to Know
Jagadeesh Aradhada